- E-Commerce
- WholesalE
- B2B
- Basic Identity
- UI/UX
- Website Development
- CRM Integration
2021

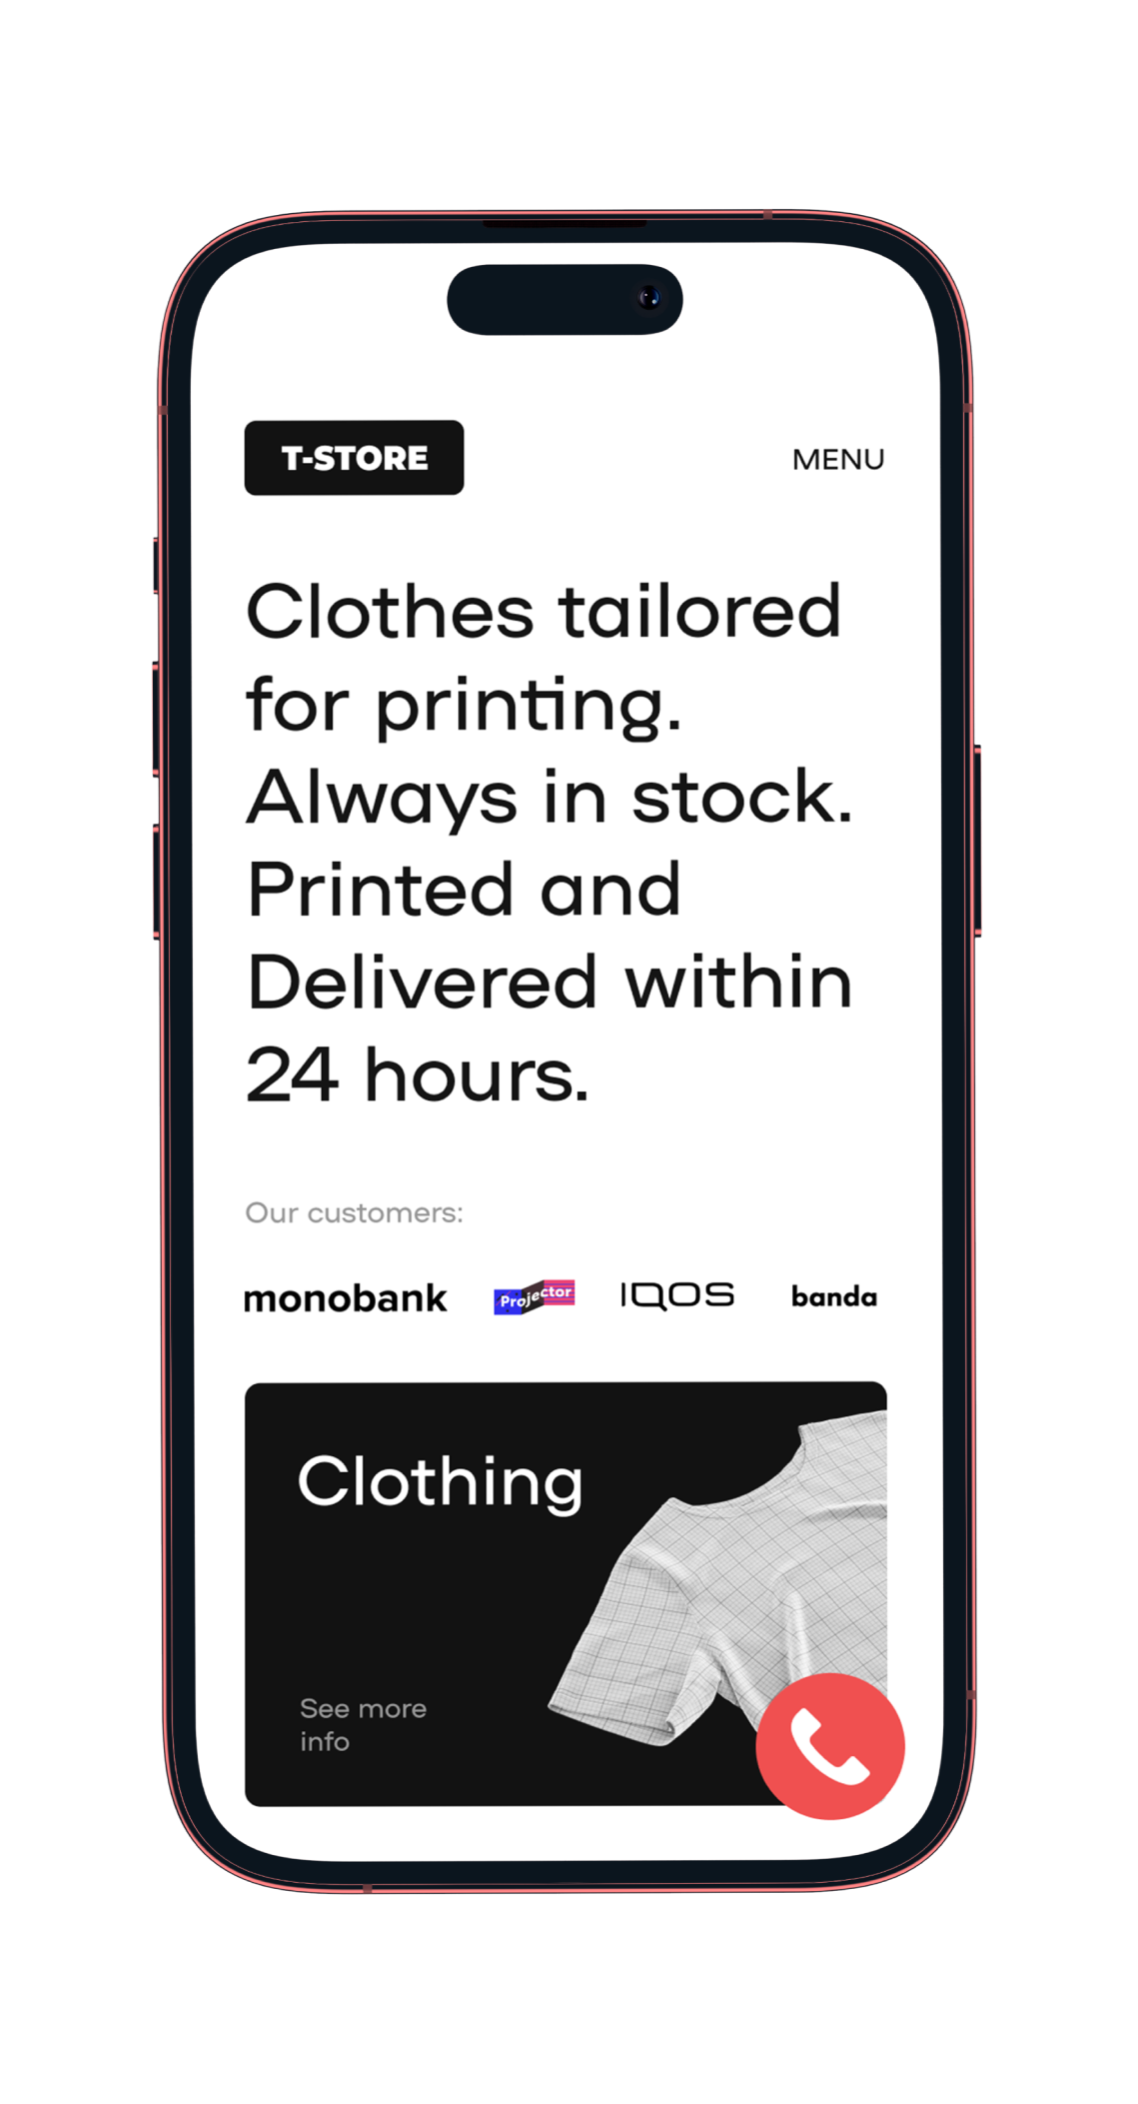
T-Store is a leading wholesale supplier of blank apparel used for print-on-demand and merchandising across Europe, with primarily focus on B2B resellers, printers, and fulfillment partners that rely on speed, clarity, and accurate pricing at scale.
FasterTime to cart
IncreaseOf Mobile usage
Reductionin Abandoned product views
UptimeDuring price fluctuation
T-Store’s previous site was optimized for static inventory and single-unit sales, but its real customer base — B2B buyers ordering hundreds of units — needed a faster, clearer, and more scalable experience. Pricing also became a major friction point, as material costs changed daily due to supply chain volatility.
The redesign needed to modernize the UI, simplify bulk ordering, and introduce real-time price syncing across all SKUs.


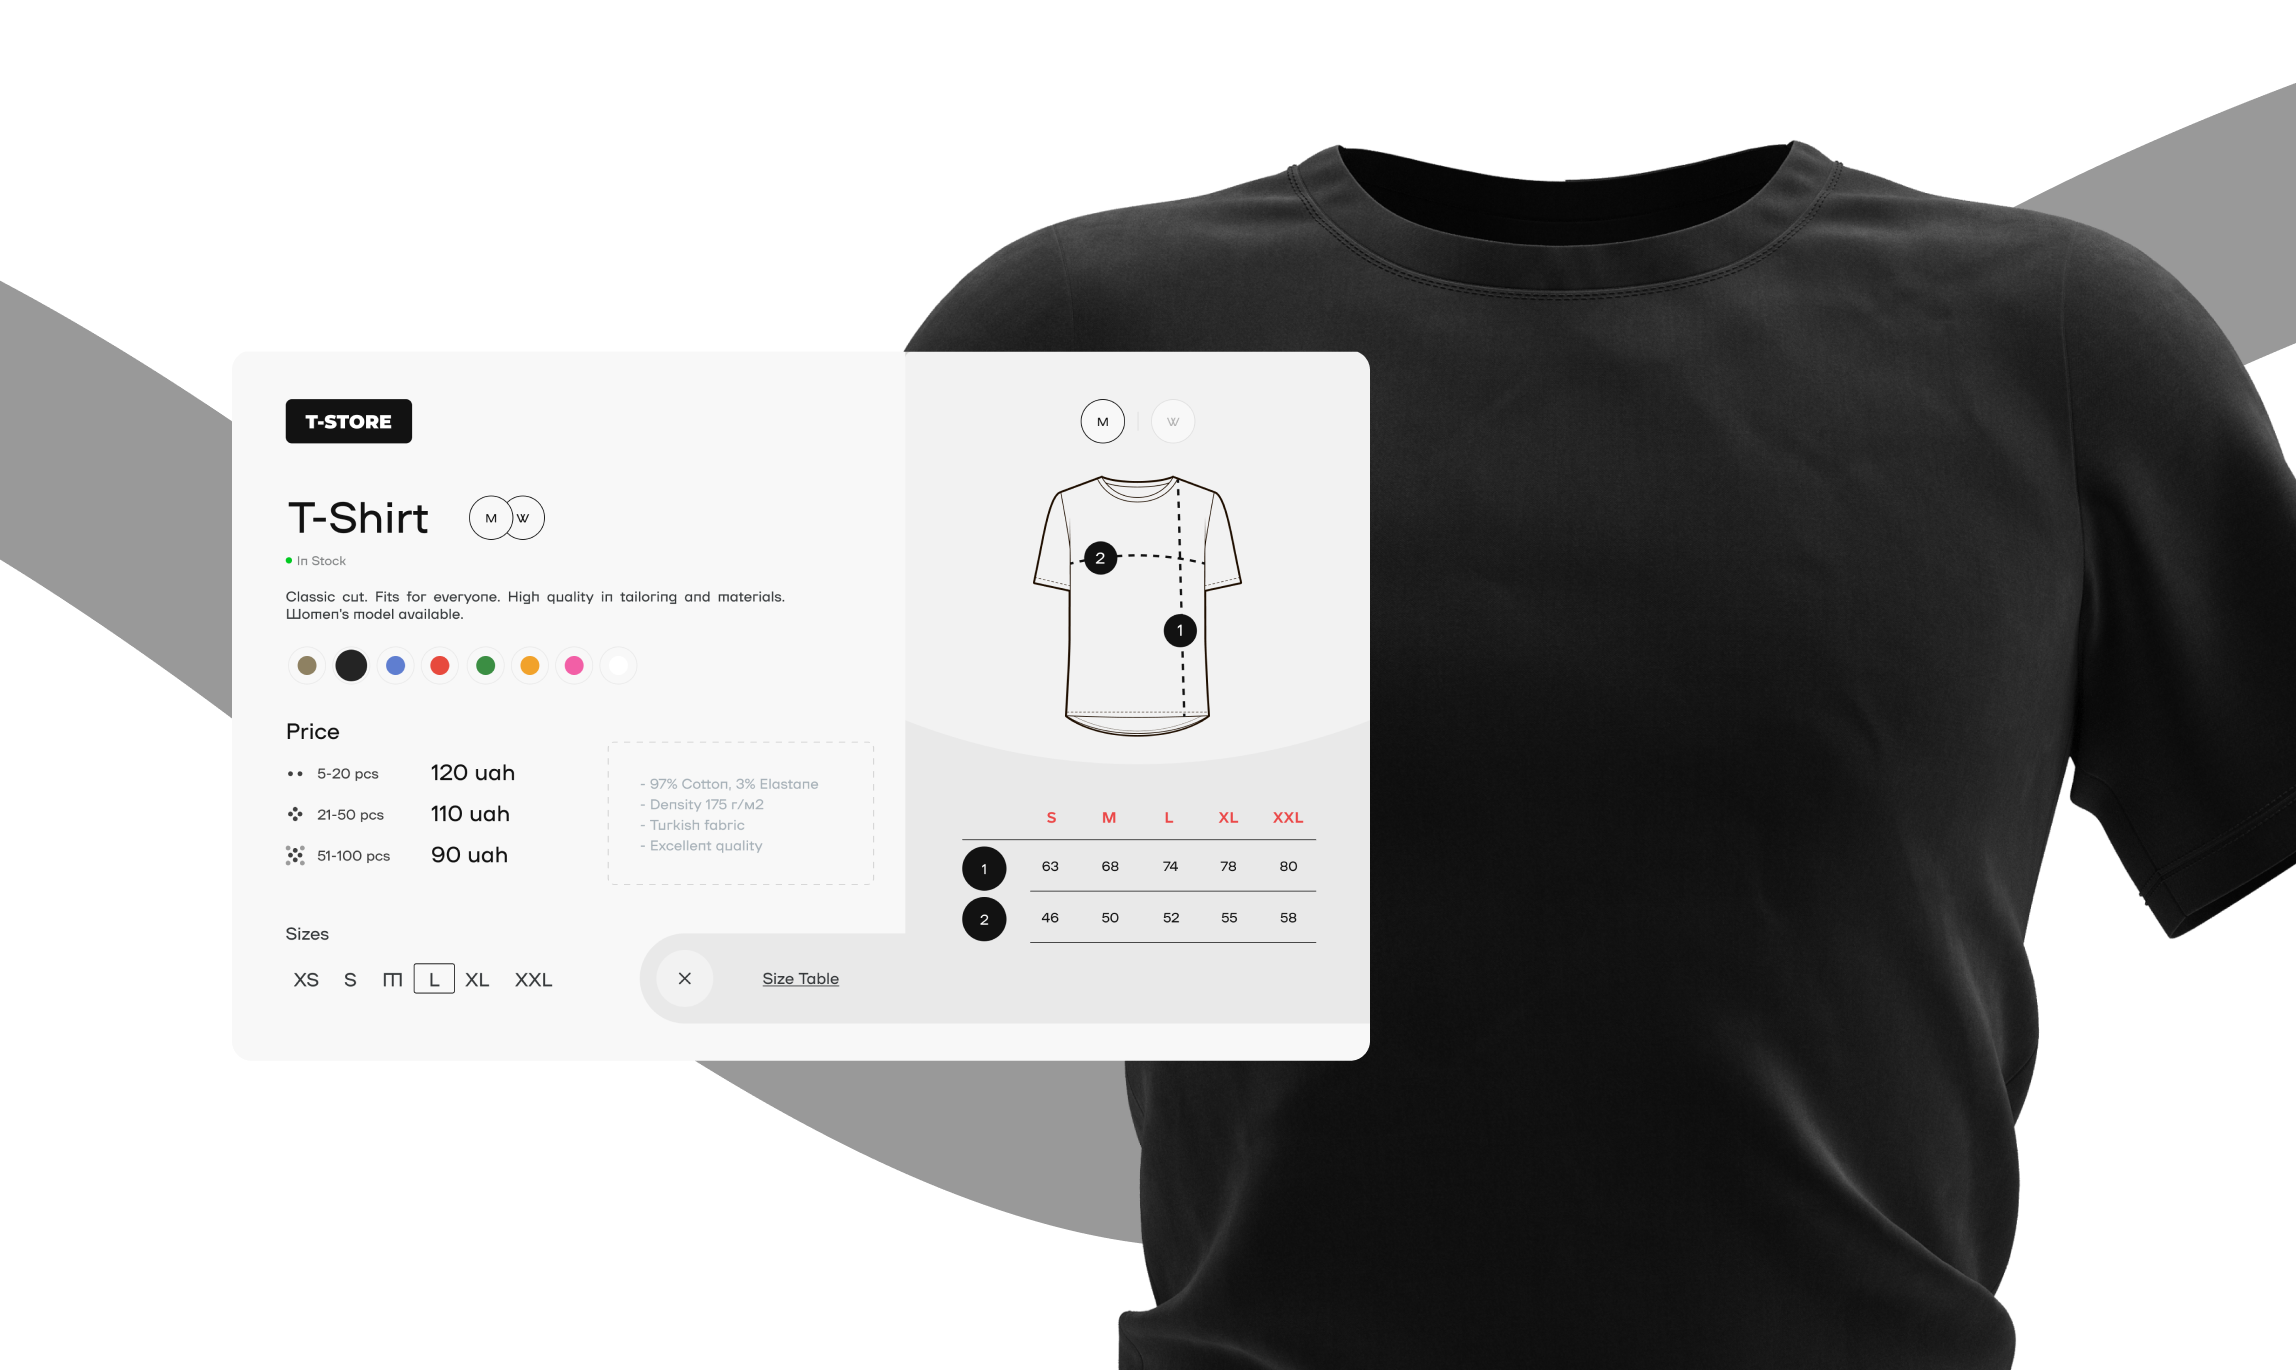
Efficient, Commercial, Product-First
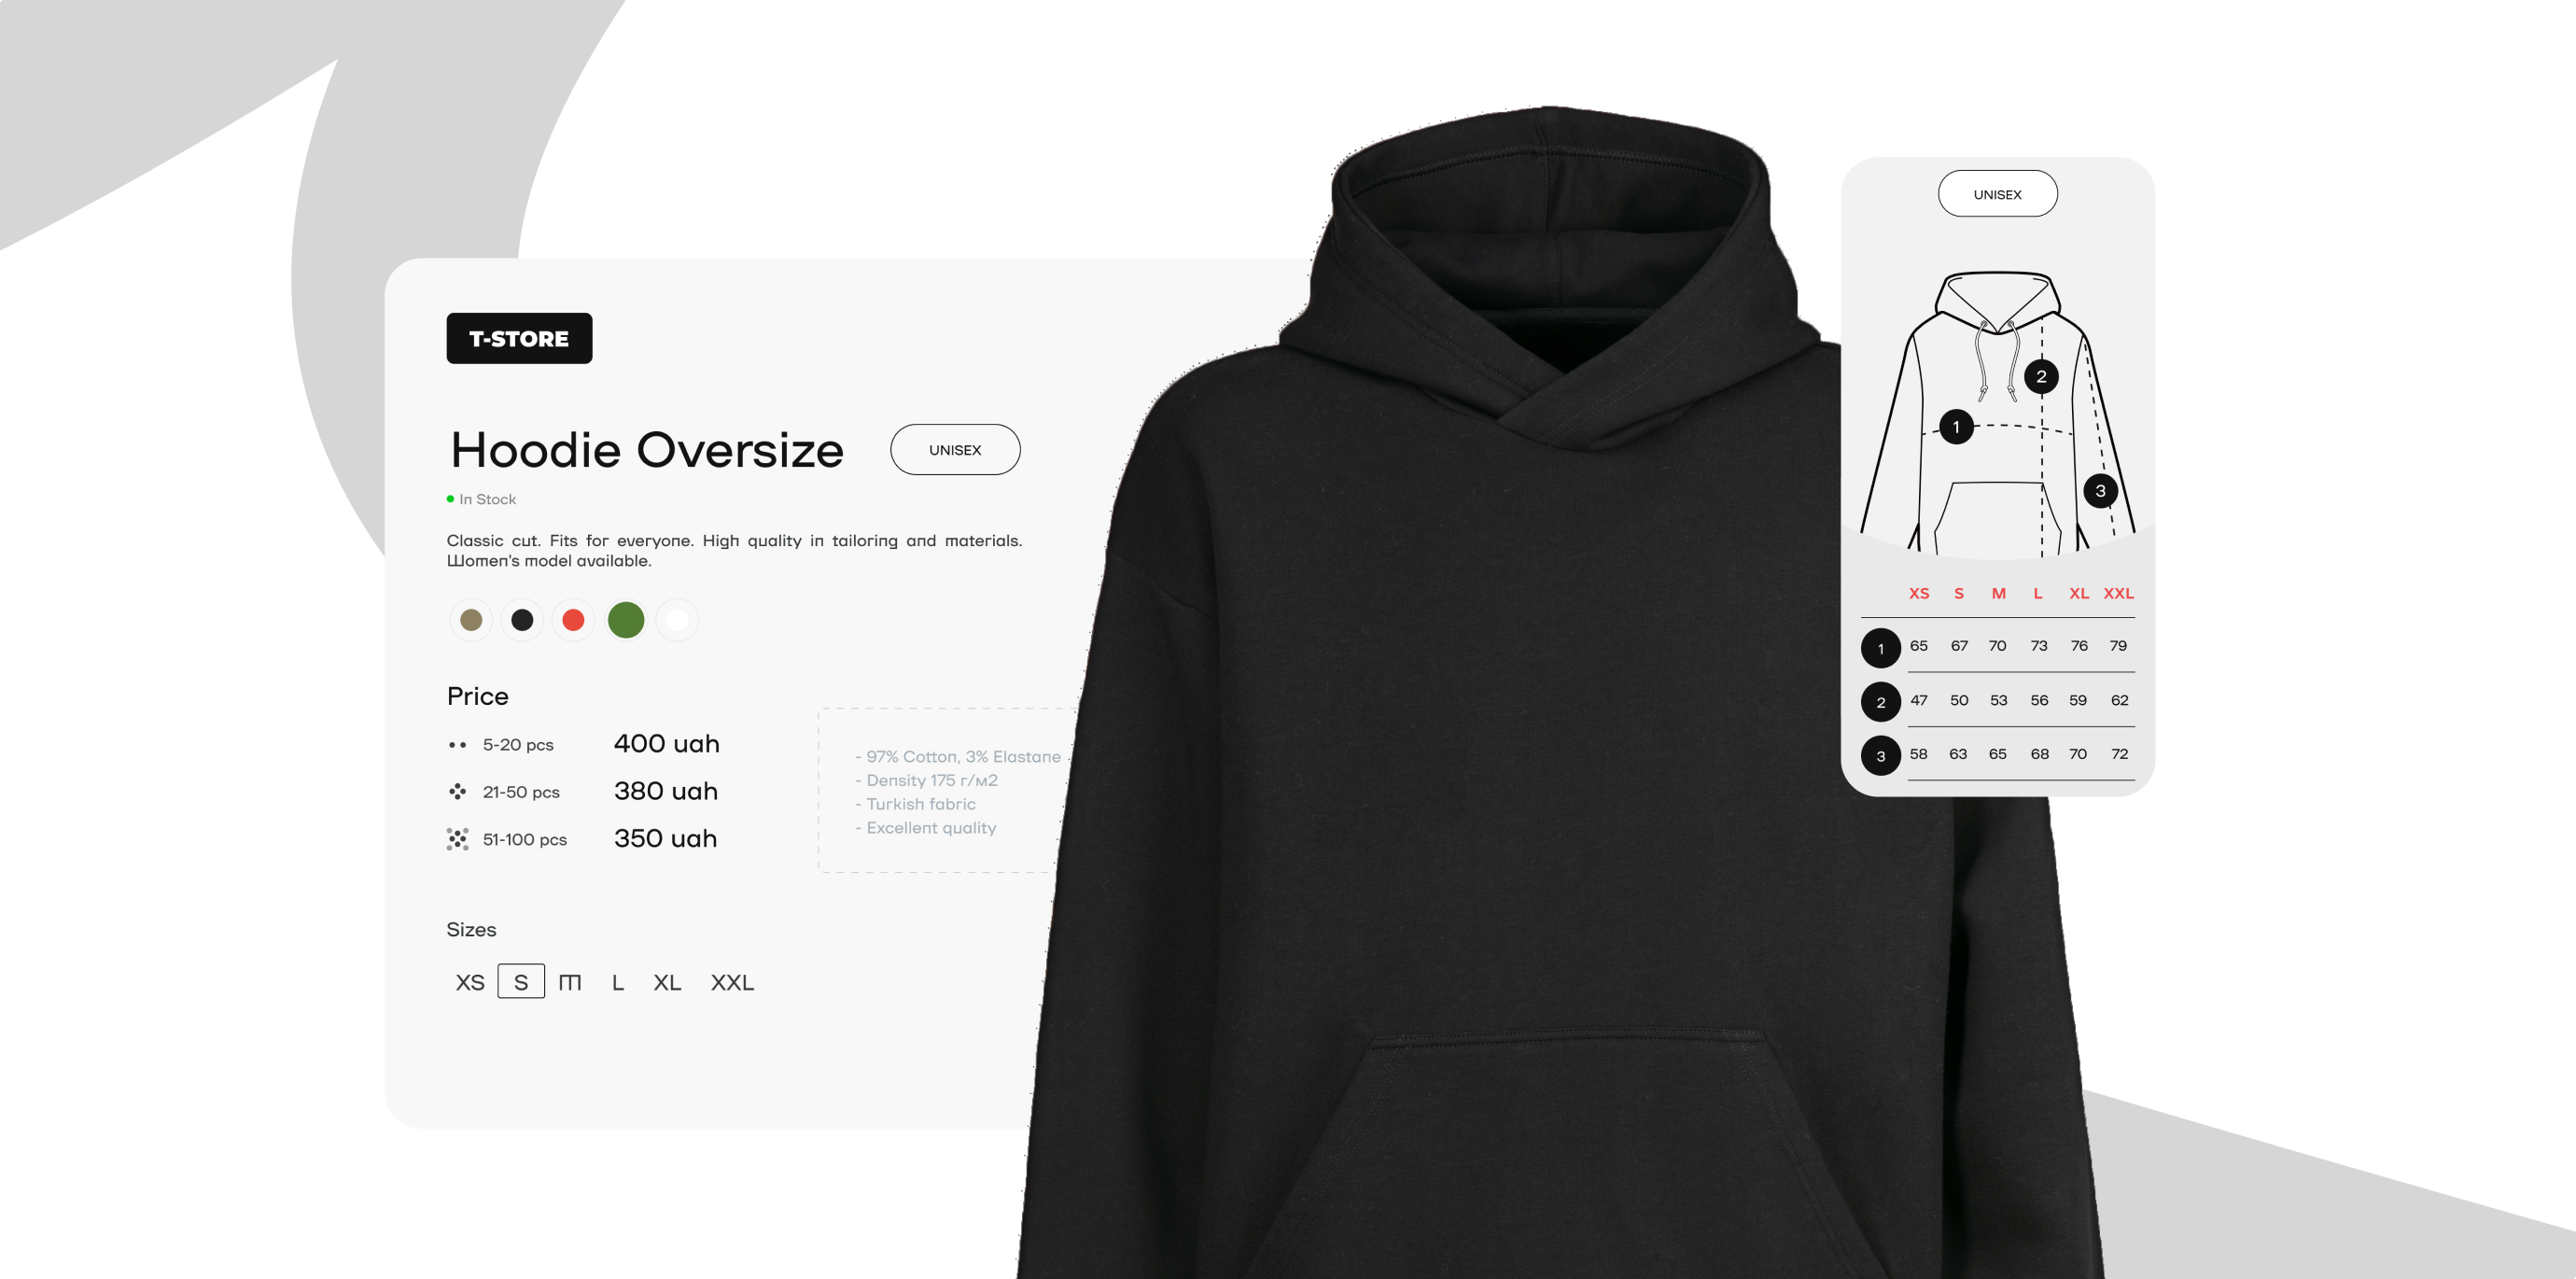
The new T-Store design puts products at the forefront. A clear, grid-based layout allows for fast scanning of hundreds of SKUs, with color-coded labels for sizes, stock, and price tiers. Typography and spacing are optimized for repeat B2B usage, where efficiency outweighs storytelling.
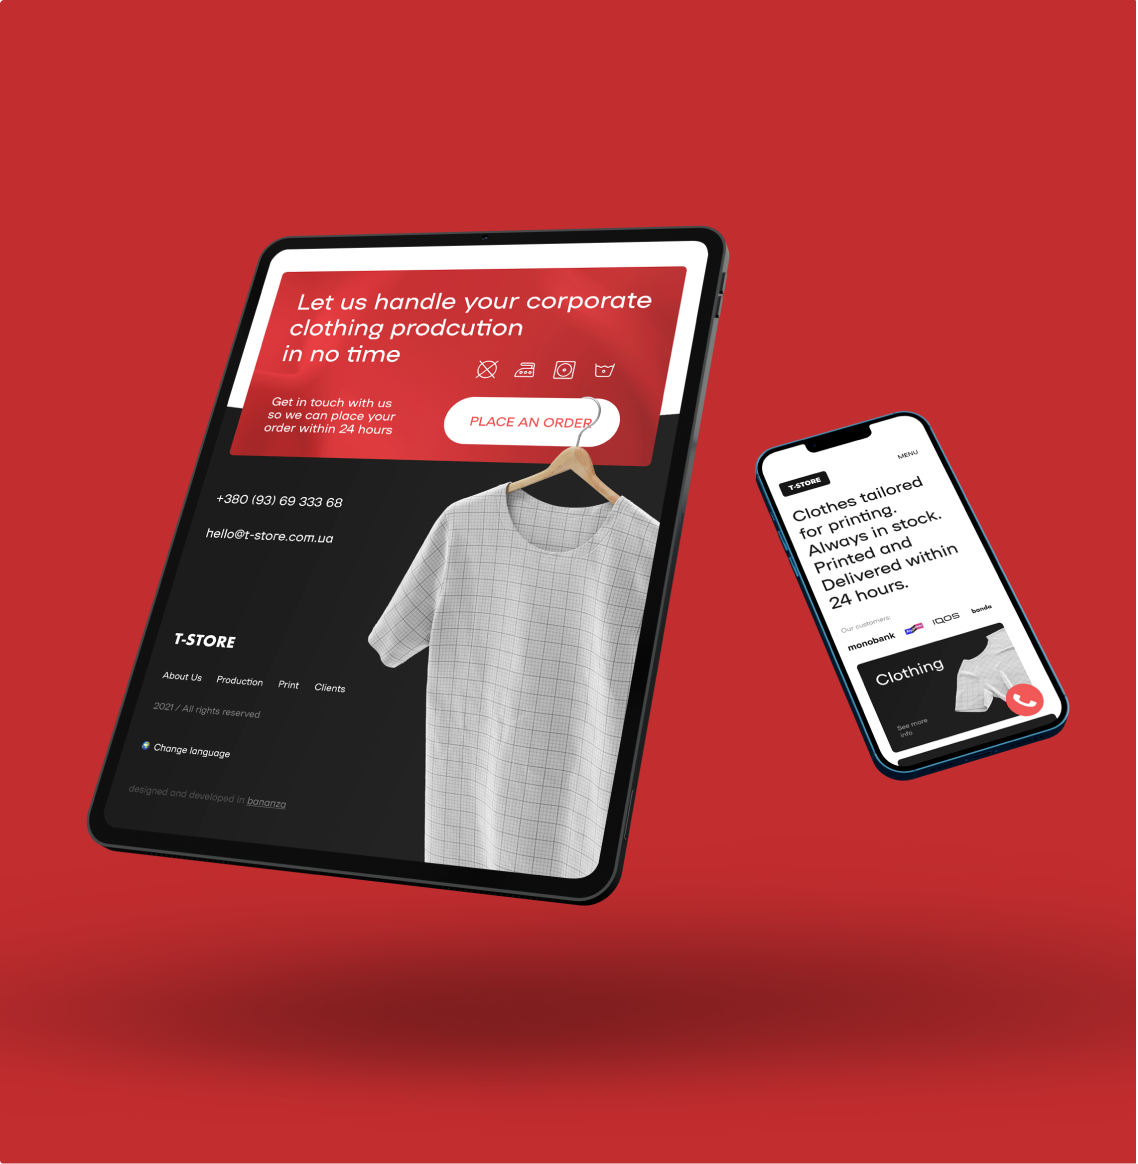
The visual language is neutral and durable, reflecting the brand’s utilitarian focus, while still offering polish and clarity across desktop and mobile.
Used for headlines works best with big titles

Used for Web app works best with regular text buttons


Real-Time Pricing and Scalable Product Architecture
Behind the scenes, the site is connected to a dynamic pricing engine that syncs with T-Store’s material supplier feeds and currency exchange APIs. Prices on product pages adjust in real time based on material cost, quantity, and location.
The tech stack supports instant cart updates, live unit conversion for international buyers, and dynamic bulk discounts. Product architecture is modular, allowing for fast addition of SKUs or materials across categories.
next js
typescript
aws
node js
postgreSQL
- FINTECH
- INVESTMENTTOOLS/DATADASHBOARDS
- GOVERNMENTBONDS
- B2C
- Basic Identity
- UI/UX
- Web App Development
- Data Architecture
2018
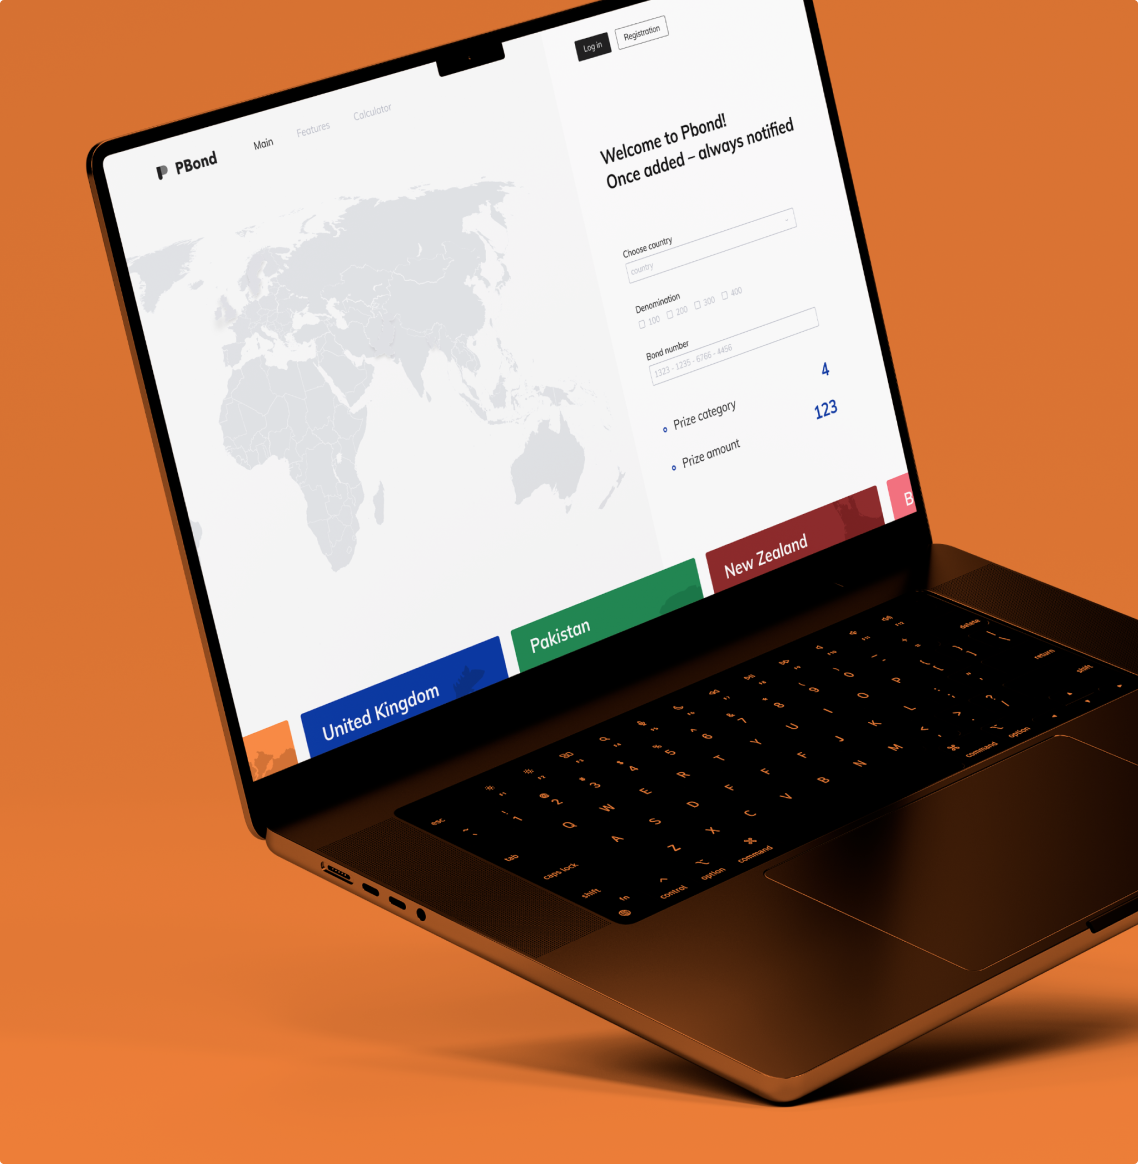
P-Bond is a web app that helps investors track, trade, and manage government bonds across countries — turning fragmented data into one clear, searchable platform for smarter bond investing.
CountriesCovered at launch
BondsTracked in Real-Time
Retentionfirst quarter after launch
minutesAverage session time
Bond data is notoriously fragmented — scattered across different formats, regions, and agency portals. Many investors manage their portfolios manually using spreadsheets or outdated software.
P-Bond’s challenge was to create a professional-grade platform that could ingest, display, and manage large sets of bond data with clarity and control — without overwhelming users.
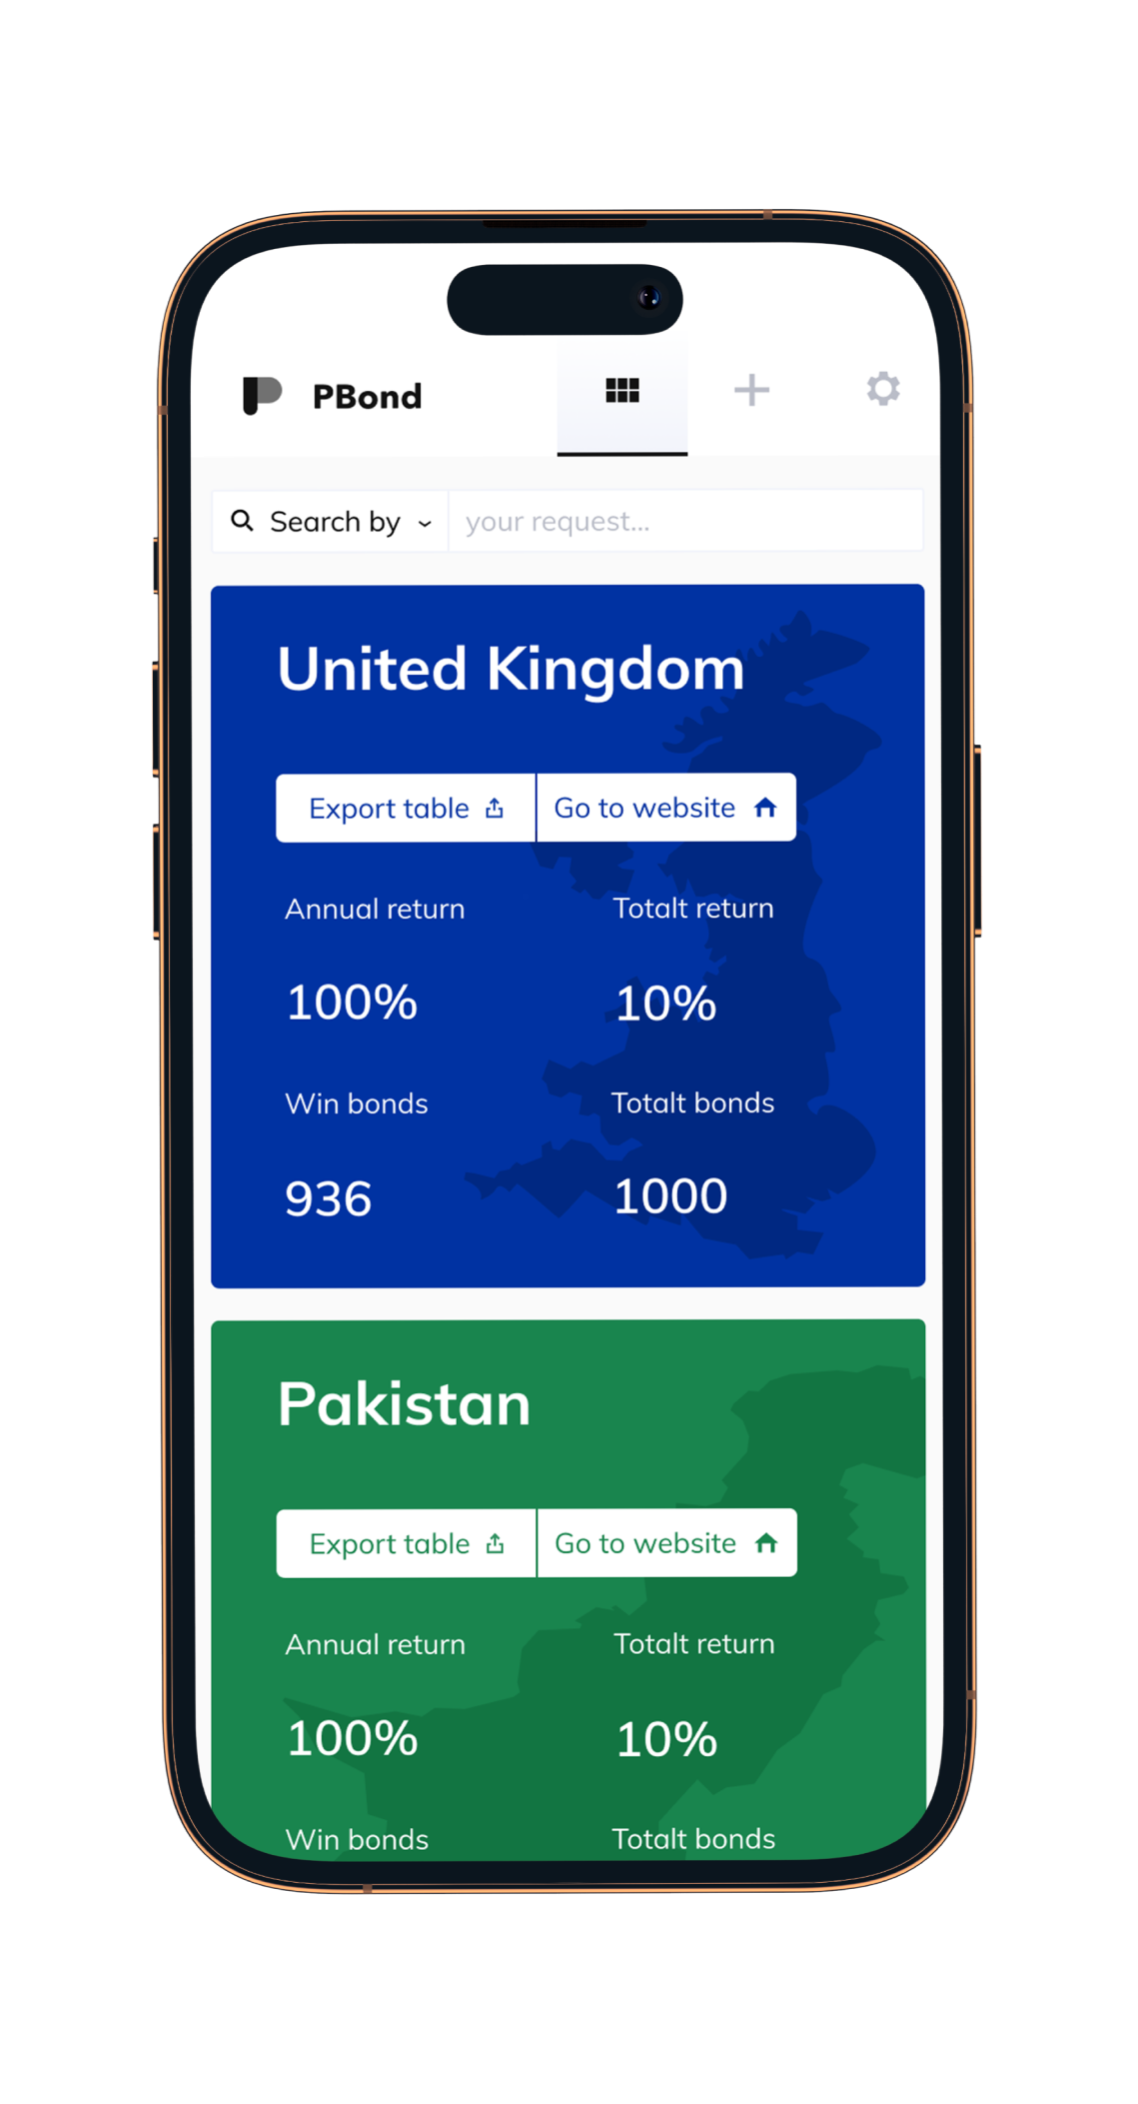
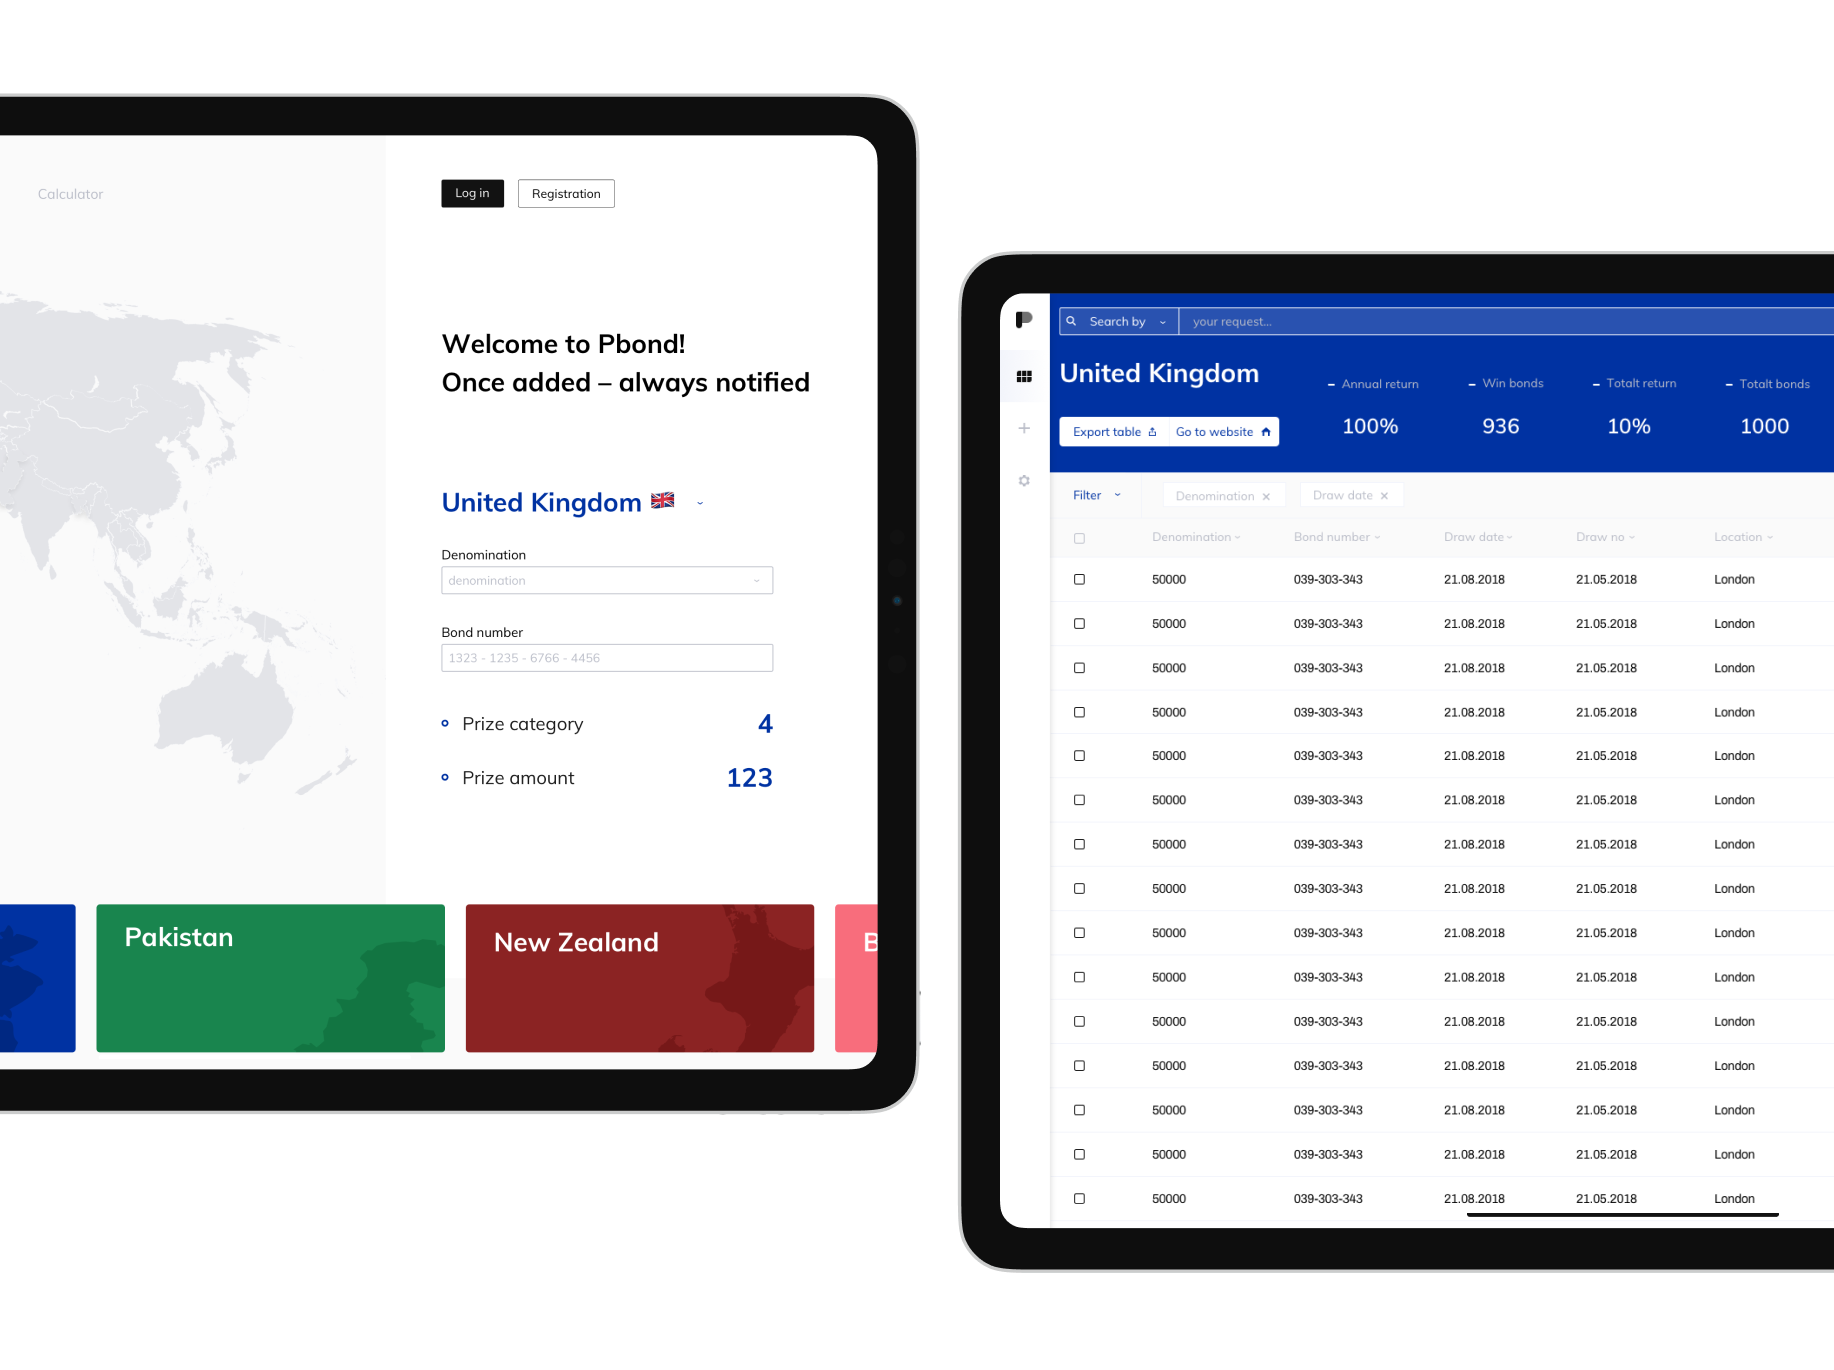
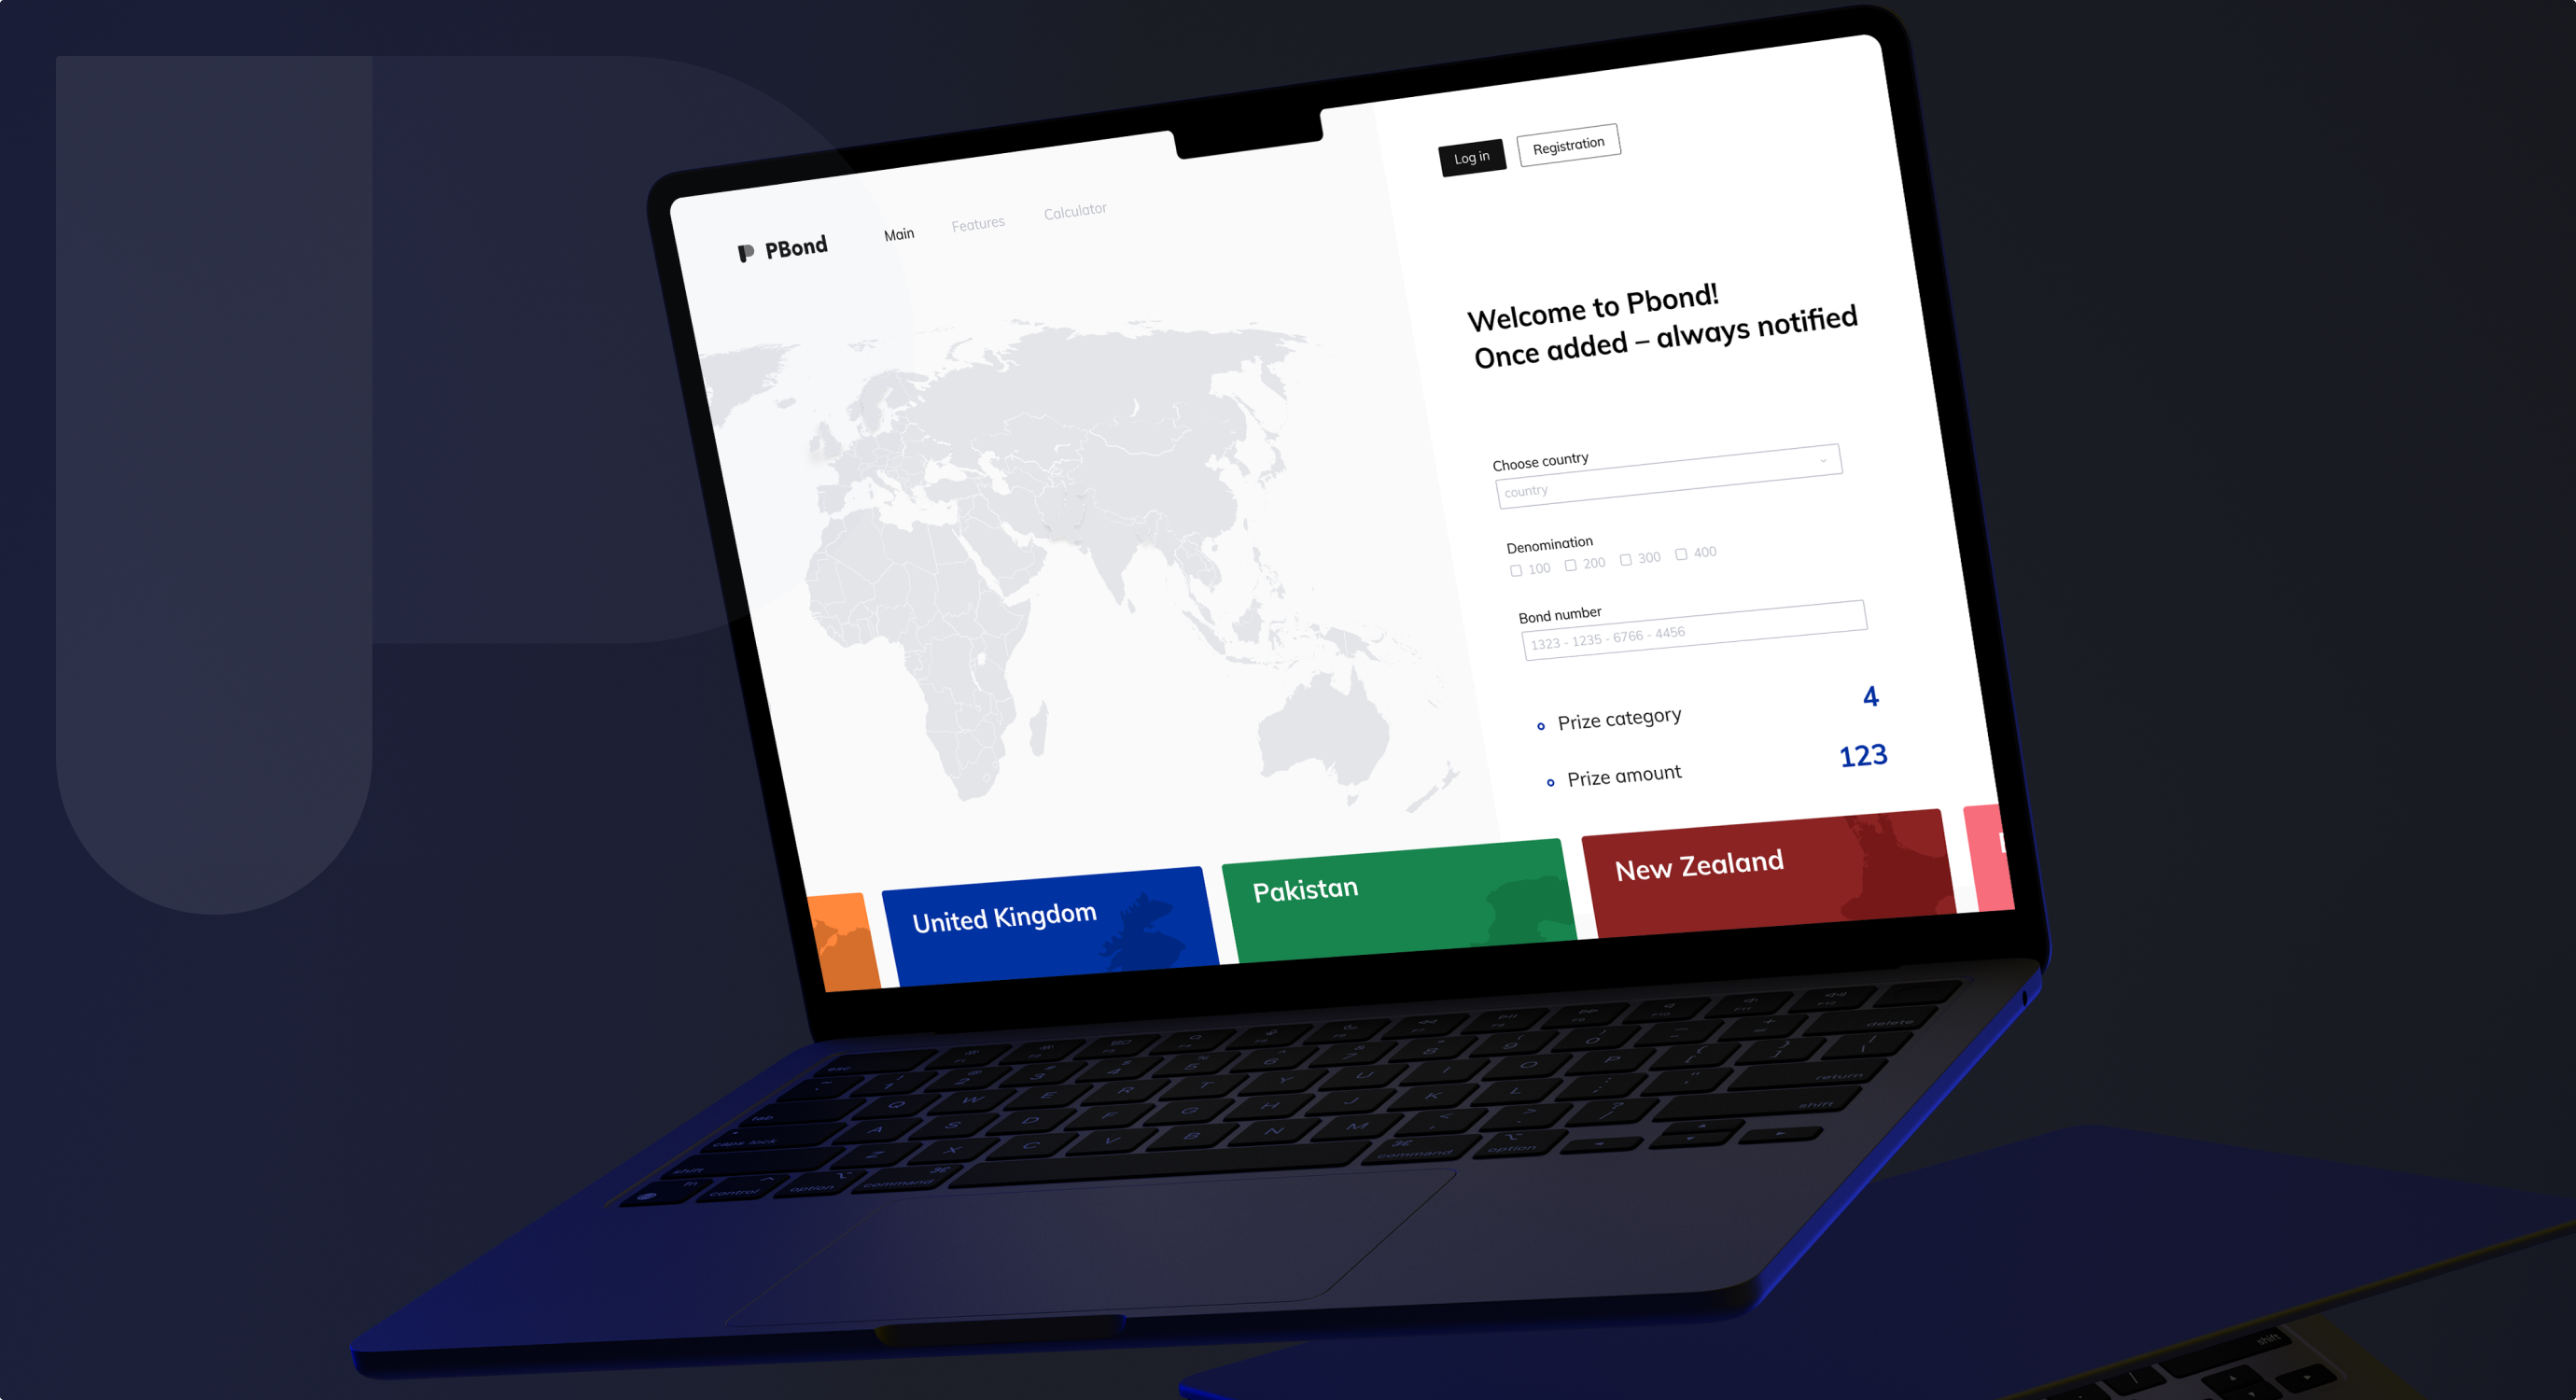
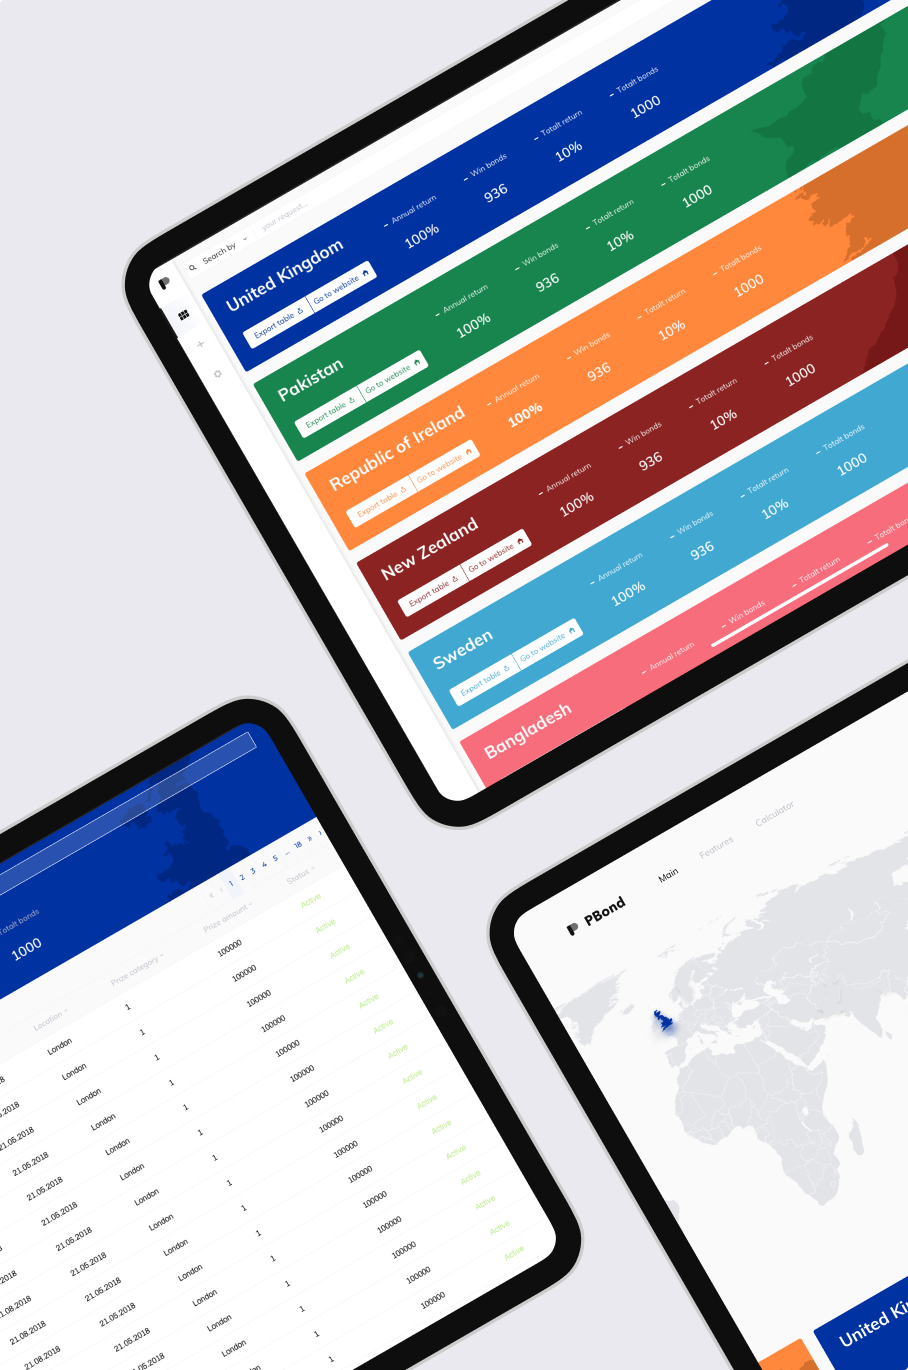
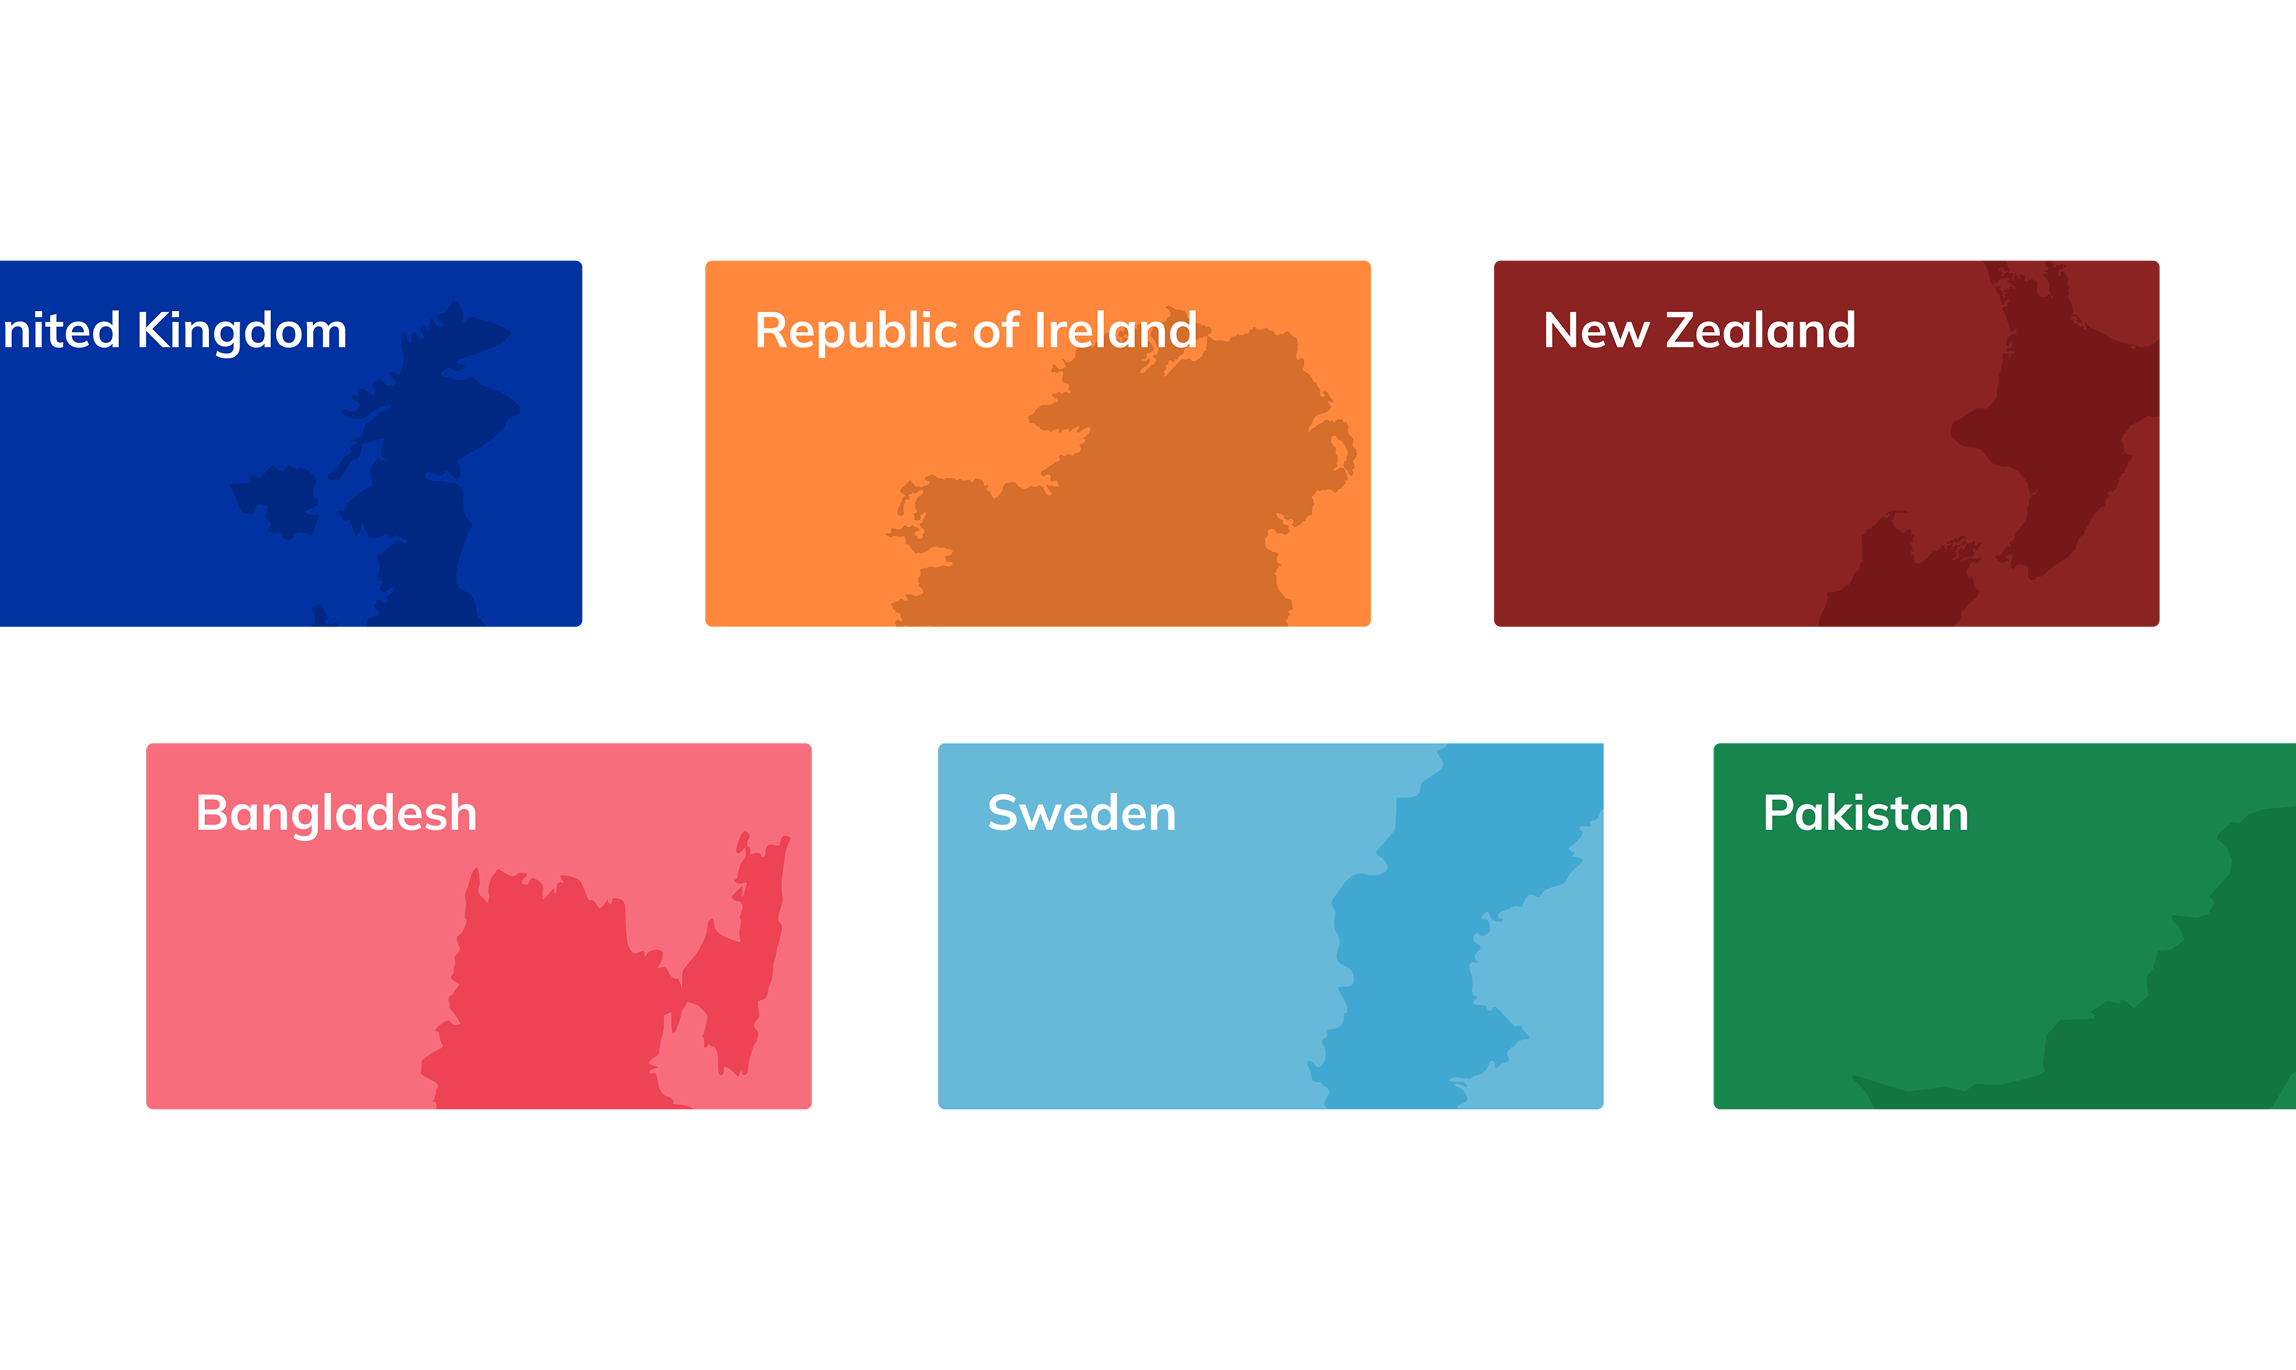
Each country has a dedicated profile page, including current bond offerings, performance data, and draw history - visually tagged and color-coded for quick navigation.
The map-based UI enhances geographic visibility, while custom search tools make large datasets feel light and responsive.
Clarity, Control, and Data Confidence
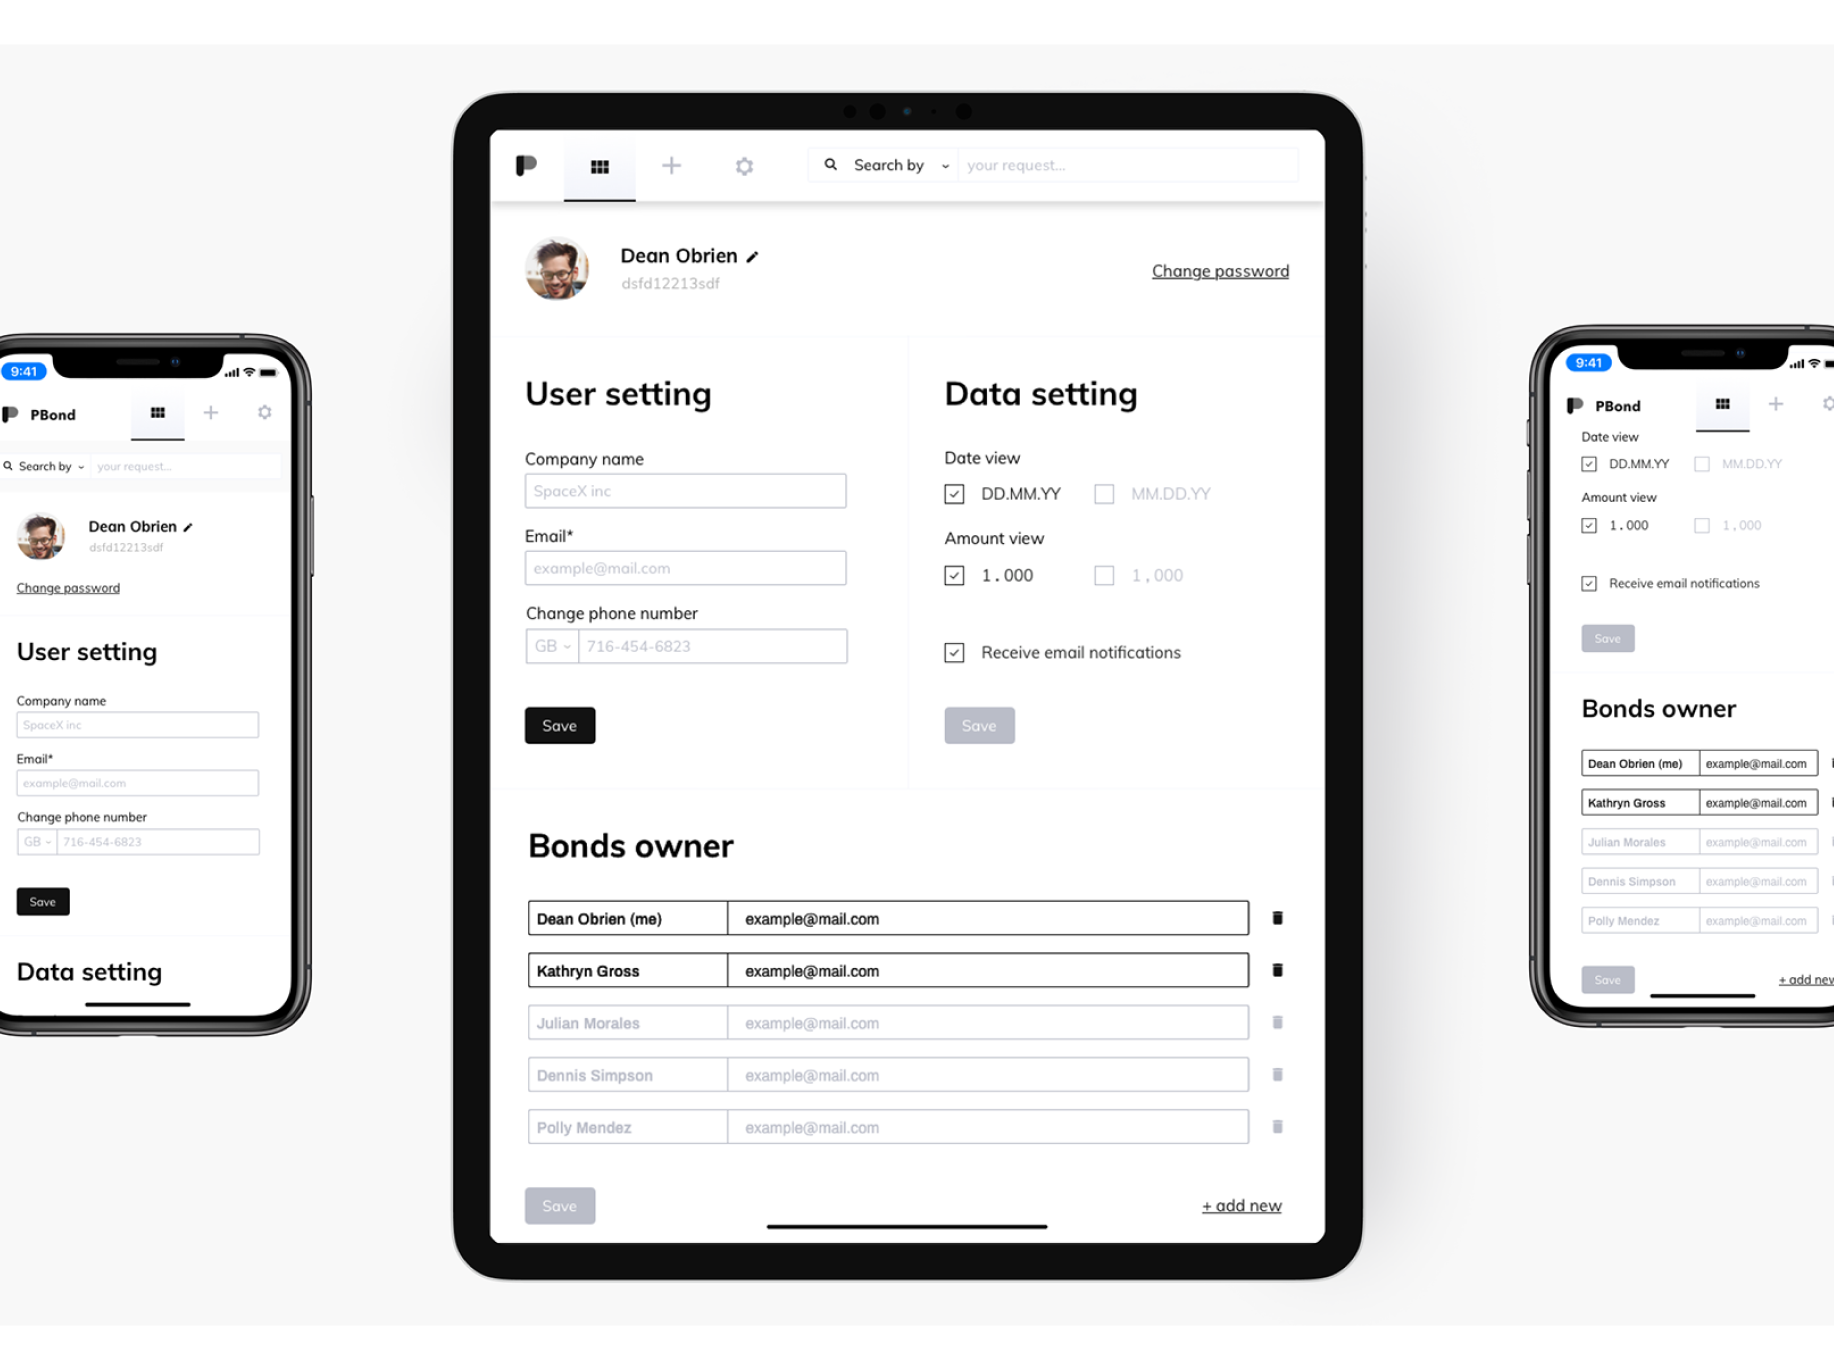
P-Bond’s design combines financial rigor with visual clarity. The interface uses structured layouts, strong typography, and smart grouping to surface important data quickly — from draw dates to payout statuses. Each country is visually separated with its own profile styling, allowing for intuitive cross-border analysis.
The design system supports both power users managing high volumes of bond data and casual investors looking for simple insights — balancing complexity with usability.
Used for headlines works best with big titles

Used for Web app works best with regular text buttons

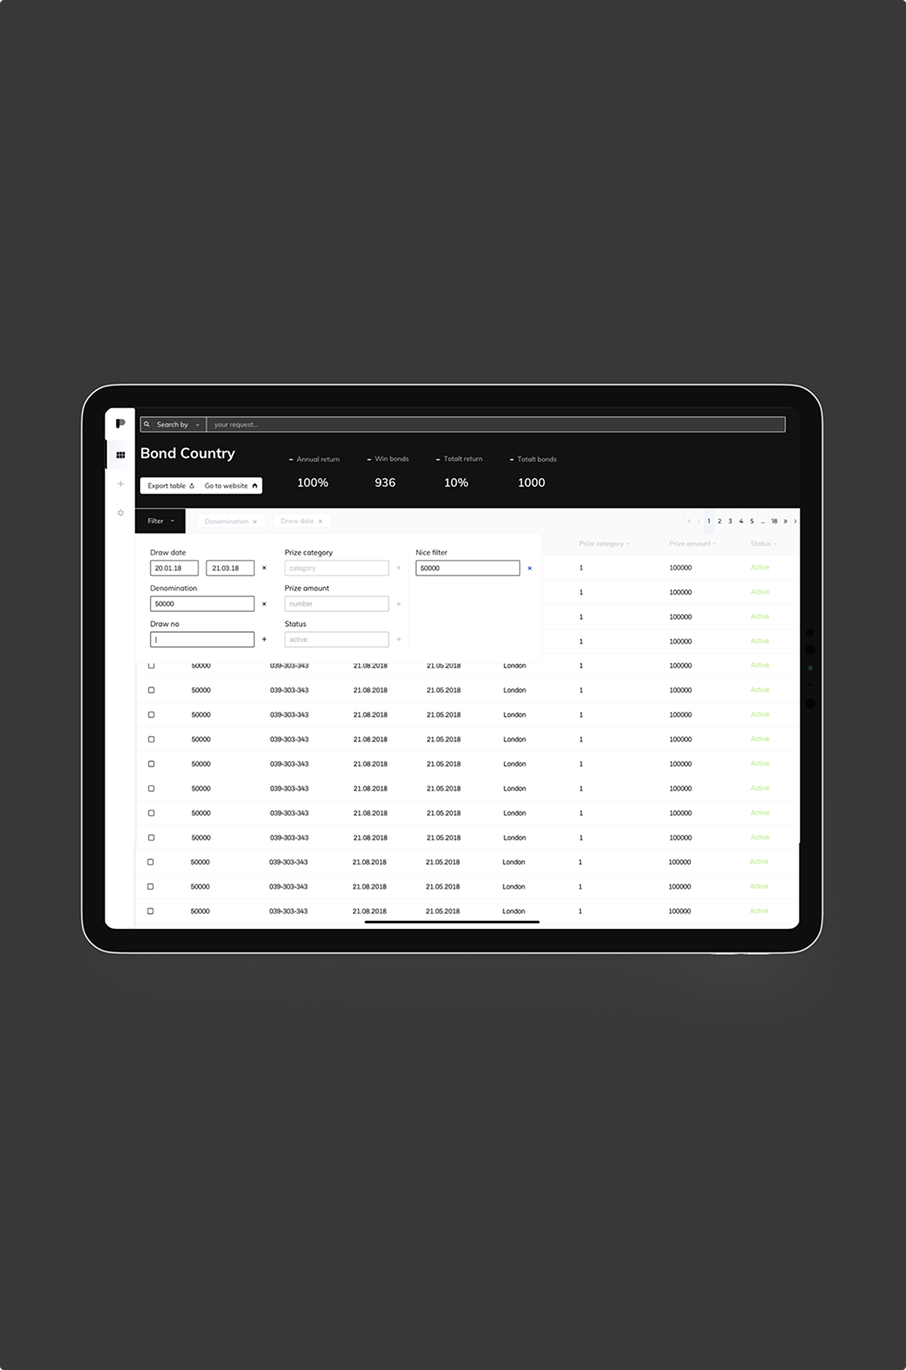
Scalable, Searchable, and Optimized for High-Volume Use
The platform is powered by a React.js frontend and a Node.js backend, with a relational database designed to support complex queries, draw schedules, and historical tracking. A custom table engine allows users to filter, sort, and tag thousands of bond records with minimal load times.
Users can import/export data, manage portfolios by tag or country, and receive automated updates on bond status or upcoming draw dates. API-ready architecture allows the platform to be integrated into external trading dashboards or institutional reporting tools.
react
node js
aws
docker
postgreSQL